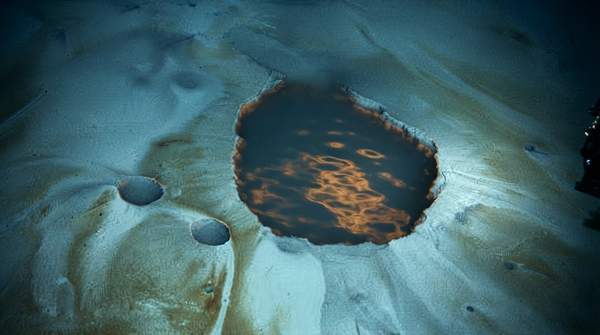
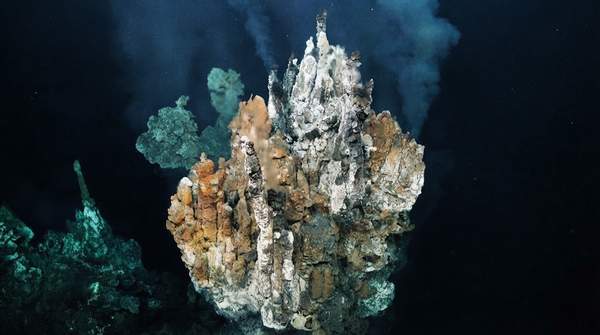
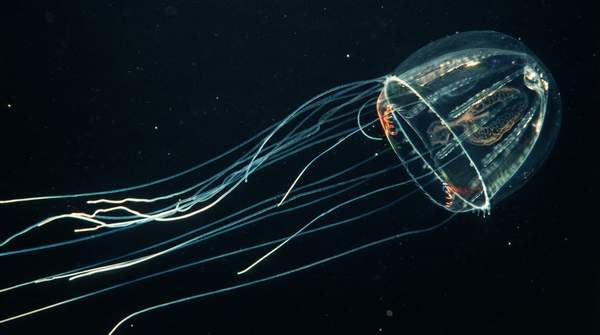
A single deep-sea expedition can generate terabytes of sensor data and imagery, yet much of this rich information remains locked in static 2D charts, hindering critical discoveries about fragile ecosystems. Over 95% of the deep ocean remains unexplored, according to Science, underscoring the immense data potential and the challenge of making sense of it.
Deep-sea data collection capabilities are rapidly advancing, but the visualization techniques used to interpret and communicate this data are lagging, creating a significant bottleneck. This disconnect means advanced sensor arrays gather petabytes of information, while analysis methods often remain surprisingly low-tech, effectively creating data graveyards where potential discoveries lie dormant.
Therefore, without widespread adoption of innovative visualization techniques, the vast potential of deep-sea research to inform conservation and resource management will remain largely unfulfilled. Companies and research institutions failing to invest in next-generation deep-sea data visualization are not just inefficient; they actively sacrifice potential breakthroughs and delay critical conservation responses.
1. Virtual Reality (VR) Immersion for Deep-Sea Ecosystems
Best for: Marine biologists, oceanographers, educators
Virtual Reality (VR) platforms allow researchers to 'swim' through 3D reconstructions of deep-sea habitats, revealing previously unnoticed ecological interactions. This immersive presence enables scientists to explore complex topographies and organism behaviors as if physically present.
Strengths: Enhanced spatial understanding, immersive exploration, strong public engagement | Limitations: Requires specialized hardware, high processing power, data preparation complexity | Price: Moderate to High
2. Augmented Reality (AR) Overlays for Field Research
Best for: Field researchers, ROV operators, survey teams
Augmented Reality (AR) systems overlay real-time sensor data and historical imagery onto live ROV video feeds, providing immediate context during deep-sea operations. This enables instant identification of geological features or known species, streamlining data collection and on-site decision-making.
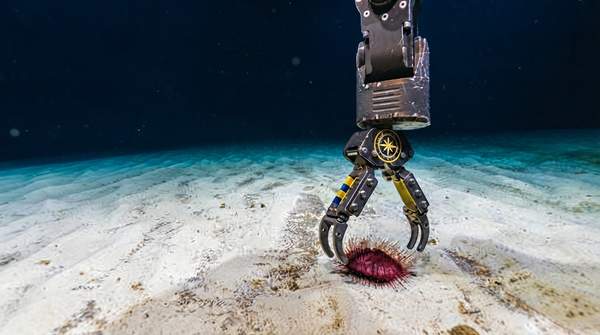
Strengths: Real-time contextualization, enhances operational efficiency, portable applications | Limitations: Limited field of view, potential for display latency, integration challenges | Price: Moderate
3. Interactive 4D Spatiotemporal Models
Best for: Oceanographers, climate scientists, population ecologists
Interactive 4D (3D + time) visualizations track deep-sea currents and their impact on larval dispersal over months, according to Nature. These models dynamically explore temporal changes, revealing how environmental factors evolve and influence deep-sea life cycles.
Strengths: Reveals dynamic processes, supports predictive modeling, complex data integration | Limitations: Computationally intensive, requires extensive time-series data, model validation challenges | Price: High
4. AI-Powered Anomaly Detection & Visualization
Best for: Data analysts, taxonomic experts, exploration teams
AI-driven visualization tools automatically detect anomalies in vast datasets—new species sightings or unusual geological formations—far faster than human review. These systems highlight deviations, directing human attention to potentially significant discoveries within petabytes of imagery and sensor readings.
Strengths: Accelerates discovery, reduces manual effort, scalable for large datasets | Limitations: Requires training data, potential for false positives, interpretability of AI findings | Price: Moderate to High
5. High-Resolution Photogrammetry & 3D Site Reconstruction
Best for: Geologists, conservation managers, archaeological researchers
High-resolution photogrammetry and 3D modeling create detailed digital twins of deep-sea sites, aiding long-term monitoring and impact assessment. These precise reconstructions allow quantitative analysis of habitat change over time, crucial for understanding human impacts or natural disturbances.
Strengths: Metric-accurate site analysis, detailed habitat mapping, baseline for change detection | Limitations: Intensive data acquisition, significant processing time, storage demands | Price: Moderate
6. Real-Time Data Streaming Dashboards
Best for: Expedition leaders, operational teams, emergency responders
Real-time data streaming and dashboard visualizations offer immediate insights for operational decisions during expeditions. These platforms consolidate live feeds from multiple sensors, providing a cohesive overview of environmental parameters and vehicle status, surpassing post-expedition static reports.
Strengths: Immediate decision support, operational awareness, customizable displays | Limitations: Requires robust network infrastructure, potential for data overload, security considerations | Price: Low to Moderate
7. Multi-Modal Data Fusion Displays
Best for: Interdisciplinary research teams, holistic ecosystem analysts
Multi-modal data fusion displays integrate diverse data streams—sonar bathymetry, video imagery, chemical sensor readings, and temperature profiles—into a single coherent visualization. This allows researchers to perceive the complex interplay between physical, chemical, and biological factors in deep-sea environments.
Strengths: Comprehensive understanding, reveals hidden correlations, supports interdisciplinary insights | Limitations: Complex data integration, requires sophisticated software, potential for visual clutter | Price: Moderate to High
8. Digital Twin Ecosystem Replicas
Best for: Ecologists, climate modelers, conservation planners
Digital twin ecosystem replicas extend 3D site reconstructions by incorporating dynamic biological and environmental models, simulating processes like nutrient flow or species migration. These interactive models serve as virtual laboratories for testing hypotheses and predicting future ecological states under various scenarios.
Strengths: Predictive capabilities, scenario testing, long-term environmental planning | Limitations: High computational cost, requires extensive ecological data for calibration, model validation challenges | Price: High
9. Advanced Geographic Information Systems (GIS) with Depth Integration
Best for: Cartographers, resource managers, regional planners
Advanced Geographic Information Systems (GIS) integrate high-resolution bathymetry and deep-sea habitat data into comprehensive spatial databases, allowing sophisticated mapping and analysis of seafloor features. These systems enable researchers to identify and manage marine protected areas with greater precision, considering complex underwater topography.
Strengths: Robust spatial analysis, data layering capabilities, established framework | Limitations: Primarily 2D/2.5D, can struggle with true 3D volumetric data, steep learning curve | Price: Low to Moderate
Comparing Deep-Sea Data Visualization Tools: Static vs. Immersive
| Visualization Type | Key Benefit | Primary Limitation | Best Use Case | Required Investment |
|---|---|---|---|---|
| Static 2D Maps/Charts | Inexpensive to produce; widely accessible | Severely limits representation of complex 3D topography and biodiversity | Initial data overview; simple distribution mapping | Low |
| Immersive 3D Visualizations (VR/AR) | Significantly enhances spatial understanding; high public engagement | Requires specialized hardware and software; complex data preparation | Detailed habitat exploration; public outreach | High |
| Real-time Data Dashboards | Offers immediate insights for operational decisions during expeditions | Requires robust network infrastructure; potential for data overload | Expedition monitoring; immediate response scenarios | Moderate |
The trade-offs between cost, complexity, and interpretive power are clear, compelling the scientific community towards investments in more advanced, albeit demanding, visualization solutions. This disparity means millions invested in data collection yield only a fraction of their potential scientific return, effectively creating a digital 'dark ocean' of unanalyzed insights.
Building Advanced Deep-Sea Ecosystem Visualizations
Developing robust data pipelines is essential to handle petabytes of raw sonar, video, and sensor data from ROVs and AUVs. These pipelines ensure data integrity and efficient processing, critical for generating meaningful visualizations from disparate sources. Interdisciplinary collaboration—between marine biologists, oceanographers, computer scientists, and graphic designers—is crucial for creating effective, scientifically accurate, and intuitive visualizations for diverse audiences. Open-source visualization librariesbraries and platforms are increasingly adopted to ensure accessibility and foster community-driven innovation in deep-sea data representation, according to ScienceDirect. Effective deep-sea visualization demands a holistic approach encompassing data management, interdisciplinary expertise, and collaborative development.
Unlocking Deep-Sea Potential: The Impact of Advanced Visualization
Studies show public engagement and understanding of deep-sea conservation issues increase by up to 40% when interactive 3D models are used compared to traditional media. This heightened engagement translates directly into greater public support and advocacy for conservation. Improved data visualization has directly led to identifying several new deep-sea species and proposing new marine protected areas in the last five years, proving its tangible impact on scientific discovery and protection efforts.
Despite progress, standardizing data formats and visualization protocols across international deep-sea research initiatives remains a significant challenge, impeding global data sharing and collaborative analysis. The future of deep-sea exploration and conservation hinges on our ability to translate data's complexity into compelling, actionable insights for scientists and the public. Without a concerted effort to bridge the visualization gap, accelerating deep-sea data generation will only exacerbate the problem, creating an ever-growing backlog of uninterpreted information and missed opportunities for understanding our planet's largest ecosystem.
FAQs: Deep-Sea Data Visualization Challenges and Solutions
Are advanced deep-sea visualization tools prohibitively expensive?
Many researchers mistakenly believe advanced visualization tools are prohibitively expensive or require extensive coding. However, numerous open-source options offer powerful capabilities without high cost. Some platforms provide free access to robust 3D rendering engines and data processing scripts, lowering the barrier for smaller institutions.
Does more deep-sea data always lead to greater understanding?
A common misconception holds that 'more data' automatically means 'more understanding'; without proper visualization, it often leads to 'data overload'. The sheer volume can overwhelm researchers, obscuring patterns or anomalies. Strategic visualization tools are essential to filter, organize, and present data in digestible formats, transforming raw inputs into meaningful insights.
What are the security concerns for shared deep-sea visualization platforms?
Concerns about data security and intellectual property rights are often raised for collaborative visualization platforms. These require robust governance frameworks and secure data encryption protocols to protect sensitive research and proprietary information. Establishing clear data ownership and access policies before collaboration begins can mitigate many security concerns, fostering trust among participating institutions.